


The Thanksgiving dip
What kind of decrease in COVID case reporting can we expect from the Thanksgiving day holiday?

EVERY HOLIDAY, the reported numbers of COVID cases and deaths tends get a bit wonky. Because this data is collected by the county and state health departments, when government offices are closed, reported information starts to get inconsistent, and usually lower. We see this every week on weekends, were Sunday/Monday totals tend to be lower because of lags in reporting.
The Thanksgiving holiday was on Thursday of this last week, and we know there is likely to be an impact on the reported cases and deaths. But what, if any, kind of impact on the reported numbers can we expect?
(Un)Luckily, the pandemic has been going on for almost 9 months, and we have three other national holidays we can look at to see what impact there might be on reporting.
Labor Day
Labor day was later than usual this year, falling on Monday September 7. This was a relatively stable part of the year for infections and deaths, so gives a good baseline.
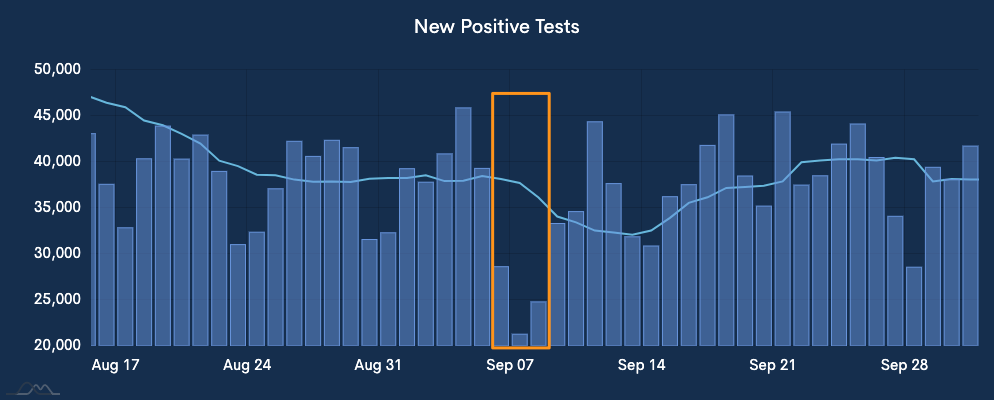
Notice the pronounced dip. Here are the cases for 7 days prior, Labor day, and one week after:
Monday, August 31: 32,300 new cases
Labor day: 21,284 (-34% from 8/31)
Monday, September 14: 30,871
Beyond the dip in reporting on Labor day itself, the next day, September 8th, also saw a significant drop from the previous week; cases were down a similar 36%. Generally, we would expect to see some rebound in reported cases in the following days, however this didn’t occur.
Instead, the combined 7 day average by about 20% on the previous week, from 38,143 on September 6 to 32,091 on September 13. The likely answer is that fewer people were seeking out testing during this time because of the holiday, and for whatever reason they never got tested again.
Memorial Day and July 4th holiday
We’ve had two other national holidays during the pandemic we can also look at to identify trends. Memorial day was Monday, May 25, however the testing volume in May was quite low.
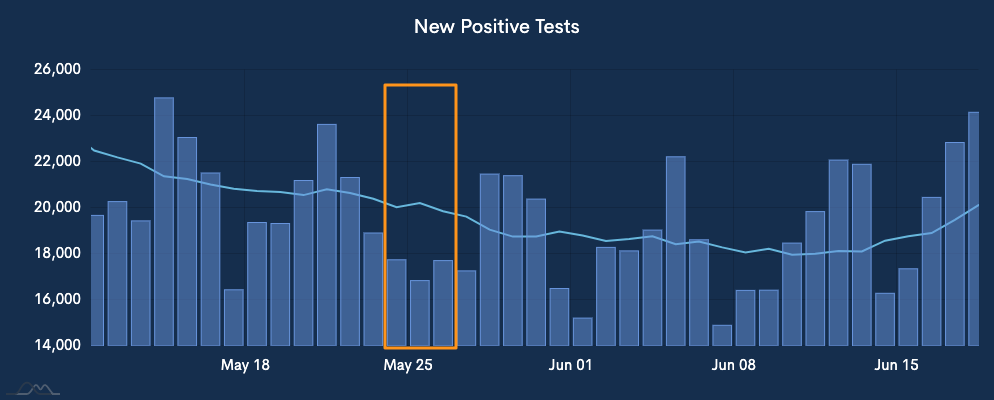
Memorial day decreased 13% when compared to the previous Monday. The overall 7-day trend was decreasing by about 2%, so while not as great an effect as Labor day, we do see a decrease.

Unfortunately for our purposes, July 4th was on a Saturday when reporting is usually low because of office closures. And as expected we don’t see much of an effect at all.
The previous 7-day average shows an increasing trend of 33% in cases reported, and Saturday July 4th was 21% above the previous Monday. The following 7-day period showed an increase of 25%. Given the smaller number of reported cases, this is well within the expected day-to-day variance.
What can we expect?
Given what we’ve seen in previous holidays, it would be safe to assume the holiday results in a dip in reporting anywhere from 10-30% below what would be reported if it weren’t a holiday. This trend usually extends for the next day or two, and backfill reporting usually catches up some, but not all of the missing cases. The number of ‘missing’ cases not reported is usually around 10%.

What we actually saw was a little different. On Thanksgiving day itself, 172,935 cases were reported, making it the second highest reported day to-date, and well above the 7-day average of 157,856.
However, Friday, November 26 saw a large reduction in reported cases, 97,874, or a 37% reduction from the 7-day average. This is on the large side, but still close to the historical drop we would expect to see.
For the next week, I would expect the 7-day average stays around 10% below where it otherwise would be. So by December 7, the number of new cases should return to about 20% above where it was two weeks ago, or around 190,000 cases per day. We can verify this by comparing with the model forecasts for

Indeed, our modeling on November 24 forecast an increase in cases of about 10% per week through the middle of January.